
What Is a Website Speed Test?
A website speed test is an analysis tool that measures how quickly your web pages load and render for users. It simulates a real visitor accessing your site and records dozens of performance metrics — from the first byte of data received from your server all the way to the moment the page becomes fully interactive. Far more than just a timer, a modern speed test reveals the underlying performance bottlenecks that are silently costing you search rankings, user engagement, and revenue every single day.
Why Website Speed Is a Direct Google Ranking Signal
Google officially confirmed page speed as a ranking factor for desktop searches in 2010 and extended it to mobile searches in 2018 through the "Speed Update." Since then, the stakes have risen considerably. In 2020, Google introduced Core Web Vitals — a specific set of measurable, user-focused performance metrics — as part of its Page Experience ranking signal, which rolled out fully in 2022. Today, every time Google crawls and evaluates your website, it also measures how fast your pages load on a simulated mid-range mobile device with a typical 4G connection. Sites that consistently score well on these metrics are rewarded with better organic visibility, while slow sites are progressively demoted in the rankings — even when their content quality is high.
The implications for SEO are profound. A business investing thousands of dollars in content marketing and link building can see all of that effort undermined by a poorly optimized WordPress site. If Google can't efficiently crawl and render your pages — if your Largest Contentful Paint is 5 seconds instead of 2 — your Crawl Budget is wasted, your indexed content is stale, and your competitors with faster sites are taking the rankings you deserve. Website speed testing is therefore not just a technical exercise; it's a foundational SEO audit that every site owner should perform regularly.
How Speed Affects Conversions and Revenue
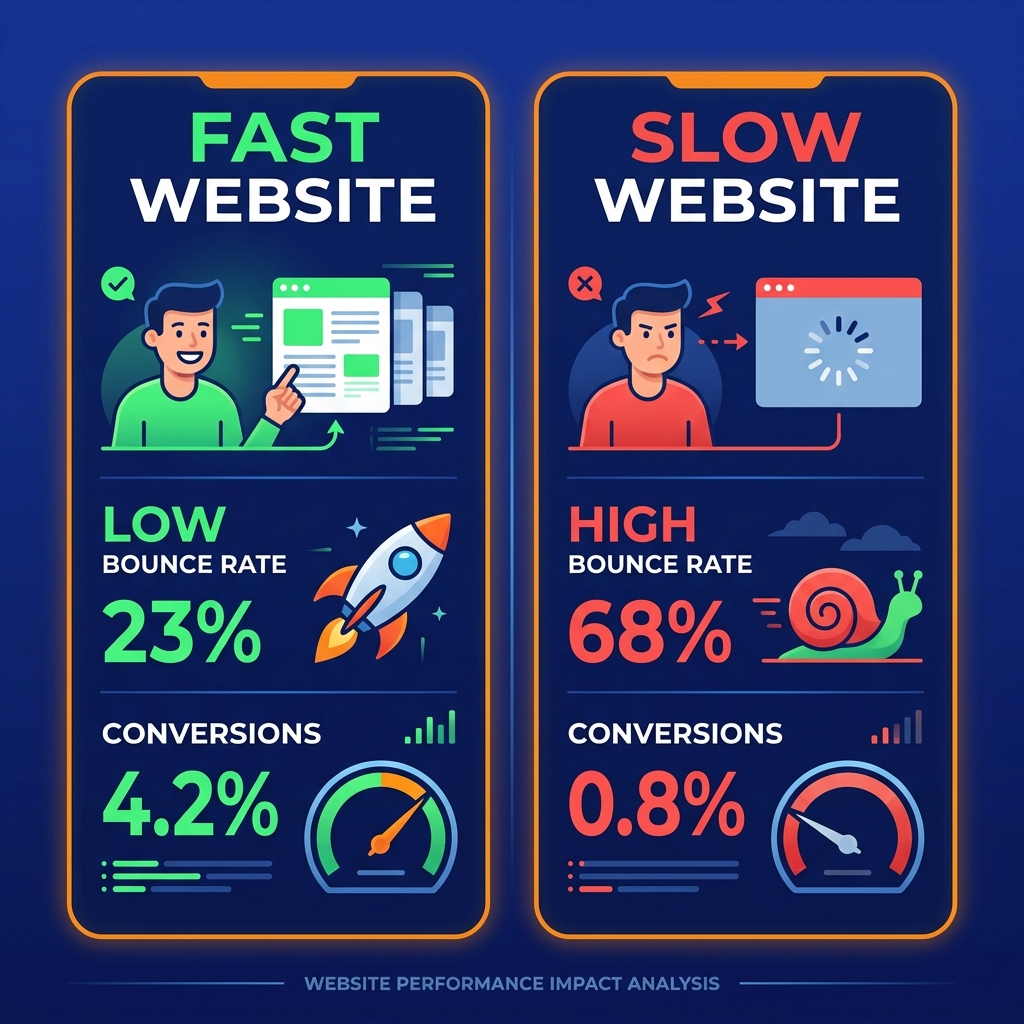
The business case for speed optimization is overwhelming. Research published by Google and corroborated by independent studies from Walmart, Amazon, and Deloitte consistently shows that every one-second delay in page load time results in approximately a 7% drop in conversions. For an e-commerce site generating $10,000 per day, that single second of delay costs roughly $255,000 per year in lost revenue. A site that loads in 1 second has a 3x better conversion rate than a site loading in 5 seconds, and a 5x better rate compared to a 10-second load time.
Bounce rates tell a similar story. Google's internal research showed that 53% of mobile users abandon a site that takes longer than 3 seconds to load. As mobile traffic has grown to represent over 60% of all web visits globally, a poor mobile speed score is now arguably the single most damaging issue a business website can have. Speed testing reveals whether your site is losing visitors before they even see your content — the hidden revenue leak that traditional analytics tools don't directly surface.
Client-Side vs Server-Side Performance
Website performance has two distinct dimensions: server-side and client-side. Server-side performance measures how quickly your hosting infrastructure generates and delivers the raw HTML of your page. Time to First Byte (TTFB) is the key server-side metric — it reflects your server's processing speed, database query efficiency, and network latency. A bloated WordPress installation with dozens of plugins querying the database on every page request can have TTFB values of 2–4 seconds even before the browser has loaded a single resource.
Client-side performance, on the other hand, measures what happens inside the browser after the HTML arrives: how quickly it parses CSS, executes JavaScript, loads images, and renders the visible page. This is where most modern performance optimization happens — through techniques like Critical CSS, lazy loading, JavaScript deferral, and image compression. A comprehensive speed test measures both dimensions, giving you a complete picture of where performance is lost and where the biggest gains can be made.
How Speed Testing Tools Measure Performance
Different speed testing tools use fundamentally different measurement approaches, which is why you can get wildly different scores for the same website depending on which tool you use. Pingdom, one of the oldest speed testing services, uses its own proprietary waterfall-based measurement system developed before Core Web Vitals existed. Its scores reflect HTTP resource loading times but don't measure actual browser rendering experience, which makes them largely irrelevant for modern SEO.
GTmetrix has evolved over the years and now incorporates both its legacy YSlow scoring system and a Lighthouse-based analysis. However, its scores are blended from multiple sources, which can create confusion, and its free plan limits the frequency and locations from which you can test. Google PageSpeed Insights uses the pure Lighthouse engine and also factors in real-world Chrome User Experience Report (CrUX) data for sites with sufficient traffic. Our PlugoSPEED Speed Test uses the same real Lighthouse engine that powers PageSpeed Insights, meaning you get the identical Core Web Vitals scores that Google sees — but with WordPress-specific interpretation and direct links to automated fixes.
Why WordPress Sites Need Specialized Speed Testing
WordPress powers approximately 43% of all websites on the internet, and its architecture creates specific, recurring performance patterns that generic speed testing tools don't address effectively. WordPress generates pages dynamically using PHP and MySQL — every page request typically triggers dozens of database queries, multiple plugin hooks, and template file inclusions before a single byte is sent to the browser. Without proper caching, WordPress is inherently slower than statically-generated sites for initial page delivery.
Furthermore, the WordPress plugin ecosystem — while an incredible strength of the platform — is also its primary performance liability. A typical business WordPress installation has 20–40 active plugins, many of which enqueue their own CSS and JavaScript on every page regardless of whether those assets are needed. This leads to massive amounts of render-blocking resources, unused CSS in the hundreds of kilobytes, and JavaScript execution that blocks the main thread for seconds at a time. Specialized speed testing for WordPress means understanding not just the metrics but the root causes specific to the platform — and that's exactly what PlugoSPEED Speed Test is designed to do.
What Are Core Web Vitals?
Core Web Vitals are a set of specific, standardized metrics defined by Google to measure real-world user experience on the web. Introduced in 2020 and made a ranking factor in 2021, Core Web Vitals focus on three dimensions of page experience: loading performance, visual stability, and interactivity. Unlike older speed metrics that measured raw file sizes or server response times, Core Web Vitals measure what users actually see and feel — making them the most meaningful and actionable performance indicators for website owners today.
Largest Contentful Paint (LCP) — Loading Performance
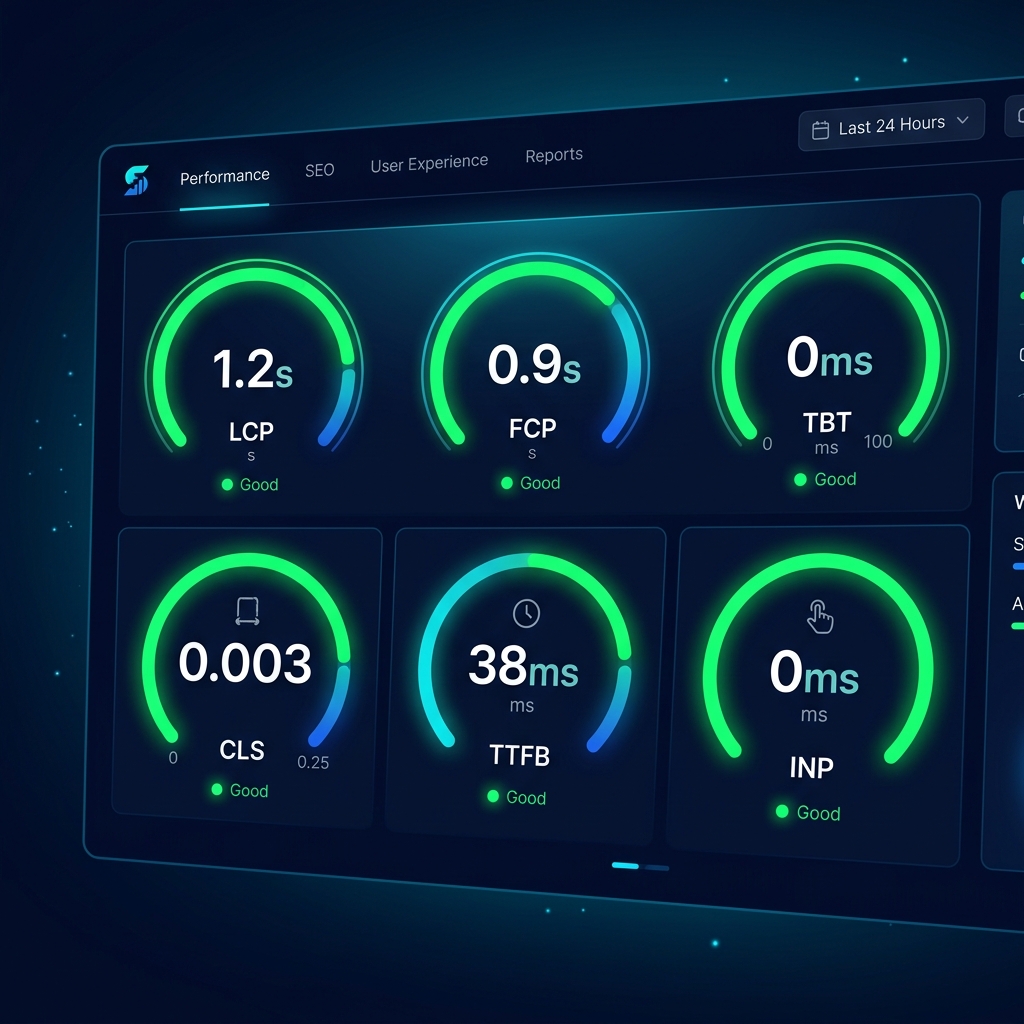
Largest Contentful Paint measures the time from when the page starts loading to when the largest visible content element in the viewport is fully rendered. This element is most commonly a hero image, a large heading, or a banner — the dominant visual element that defines the initial page experience. Google's good threshold for LCP is under 2.5 seconds; values between 2.5 and 4 seconds need improvement; anything above 4 seconds is considered poor.
LCP is arguably the most impactful Core Web Vital for SEO because it directly represents the perceived loading speed from the user's perspective. The most common causes of slow LCP in WordPress include: unoptimized hero images served in legacy formats like JPEG or PNG instead of WebP; render-blocking CSS that prevents the browser from painting any content until stylesheets are fully downloaded and parsed; slow server response times (TTFB) that delay the delivery of all resources; images not marked with fetchpriority="high" so the browser doesn't know to prioritize them; and third-party scripts that compete for bandwidth during initial load.
Fixing LCP typically involves a combination of server-side improvements (better hosting, page caching, CDN), image optimization (WebP conversion, proper sizing, preloading the LCP image), and render path optimization (Critical CSS to eliminate render-blocking stylesheets). PlugoSPEED Pro addresses all three dimensions automatically, and our speed test will flag your specific LCP element so you know exactly what to optimize.
First Contentful Paint (FCP) — Initial Render Speed
First Contentful Paint measures the time from navigation start until the first piece of content — any text, image, SVG, or canvas — is painted to the screen. While LCP measures the dominant content, FCP measures the very first visual feedback the user receives. Google's good threshold for FCP is under 1.8 seconds; values between 1.8 and 3 seconds need improvement; anything above 3 seconds is poor.
FCP and LCP are closely related — a slow FCP almost always leads to a slow LCP. The primary causes of slow FCP are render-blocking resources (particularly stylesheets loaded in the <head> that must be fully parsed before the browser renders anything), server-side processing delays that increase TTFB, and heavy synchronous JavaScript that delays the browser's rendering pipeline. The fix for FCP in WordPress typically involves implementing Critical CSS (inlining only the styles needed for above-the-fold content and deferring the rest), which is one of PlugoSPEED Pro's flagship features.
Total Blocking Time (TBT) — JavaScript Execution
Total Blocking Time measures the total duration of time between First Contentful Paint and Time to Interactive during which the main thread was blocked long enough to prevent input responsiveness. It captures all "long tasks" — JavaScript execution blocks lasting more than 50 milliseconds — and sums up the time beyond that 50ms threshold. Google's good threshold for TBT is under 200 milliseconds; values between 200ms and 600ms need improvement; anything above 600ms is poor.
TBT is the lab-environment proxy for Interaction to Next Paint (INP). High TBT means your JavaScript is blocking the browser's main thread, making the page feel sluggish and unresponsive during load. In WordPress, TBT is commonly caused by: heavy plugin JavaScript bundles loaded synchronously; multiple competing analytics and marketing scripts; jQuery-dependent plugins that execute on page load even when not immediately needed; and Elementor or other page builder scripts that initialize large frameworks even on simple pages.
Reducing TBT requires deferring non-critical JavaScript until after the page has finished rendering, removing unnecessary scripts, and breaking up large JavaScript bundles into smaller chunks. PlugoSPEED Pro's JavaScript delay feature intelligently defers script loading until user interaction, which can dramatically reduce TBT and improve your overall performance score.
Cumulative Layout Shift (CLS) — Visual Stability
Cumulative Layout Shift measures the visual stability of a page — specifically, how much the layout shifts unexpectedly during the loading process. When content shifts after a user has started reading or clicking, it creates a frustrating experience and can lead to accidental clicks. CLS is calculated using an impact fraction (how much content moved) multiplied by a distance fraction (how far it moved), summed across all unexpected layout shifts. Google's good threshold is below 0.1; values between 0.1 and 0.25 need improvement; anything above 0.25 is poor.
Common causes of CLS in WordPress include: images and videos without explicit width and height attributes, which cause the browser to allocate no space for them until they load; web fonts that cause a "flash of unstyled text" and shift surrounding content; dynamically injected content like cookie banners, popup notifications, or late-loading widgets; ads served in containers without fixed dimensions; and WordPress themes that load fonts asynchronously without proper fallback sizing. Fixing CLS typically requires adding explicit dimensions to all media elements, using font-display: swap or preloading fonts, and reserving space for dynamic elements before they load.
Time to First Byte (TTFB) — Server Response Speed
Time to First Byte measures the duration from the browser's initial request for a page to when the first byte of the server's response is received. It encompasses DNS lookup time, TCP connection establishment, SSL handshake time, and the server's actual processing time to generate the HTML response. Google's good threshold for TTFB is under 800 milliseconds; values between 800ms and 1800ms need improvement; anything above 1800ms is poor.
TTFB is the foundation of all other performance metrics — a slow TTFB delays everything else. For WordPress sites, TTFB is often the primary bottleneck. Without page caching, WordPress must execute PHP, query MySQL, load plugin functions, and compile the template for every single page request. On shared hosting with limited CPU and memory, this process can take 1–3 seconds before the browser even receives the first HTML character. Enabling a full-page caching plugin (which serves pre-built HTML files), upgrading to better hosting, or adding a CDN in front of your site are the most impactful TTFB improvements available.
Interaction to Next Paint (INP) — Runtime Responsiveness
Interaction to Next Paint replaced First Input Delay (FID) as a Core Web Vital in March 2024. While FID only measured the delay before the browser could respond to the first user interaction, INP measures the full latency of all interactions throughout the entire page session — clicks, taps, and keyboard inputs — and reports the worst-case interaction delay (with some outlier exclusion). Google's good threshold for INP is under 200 milliseconds; values between 200ms and 500ms need improvement; anything above 500ms is poor.
INP is particularly relevant for dynamic WordPress pages with complex interactivity: mega menus, filter dropdowns, AJAX cart updates in WooCommerce, live search, and accordion elements. High INP is caused by long-running event handlers, excessive DOM size (too many HTML elements), layout thrashing (reading and writing to the DOM in rapid alternation), and rendering work triggered by user events. Improving INP requires optimizing JavaScript execution paths, reducing DOM complexity, and using modern web APIs like scheduler.postTask() for non-critical work.
PlugoSPEED vs GTmetrix vs Pingdom vs PageSpeed Insights
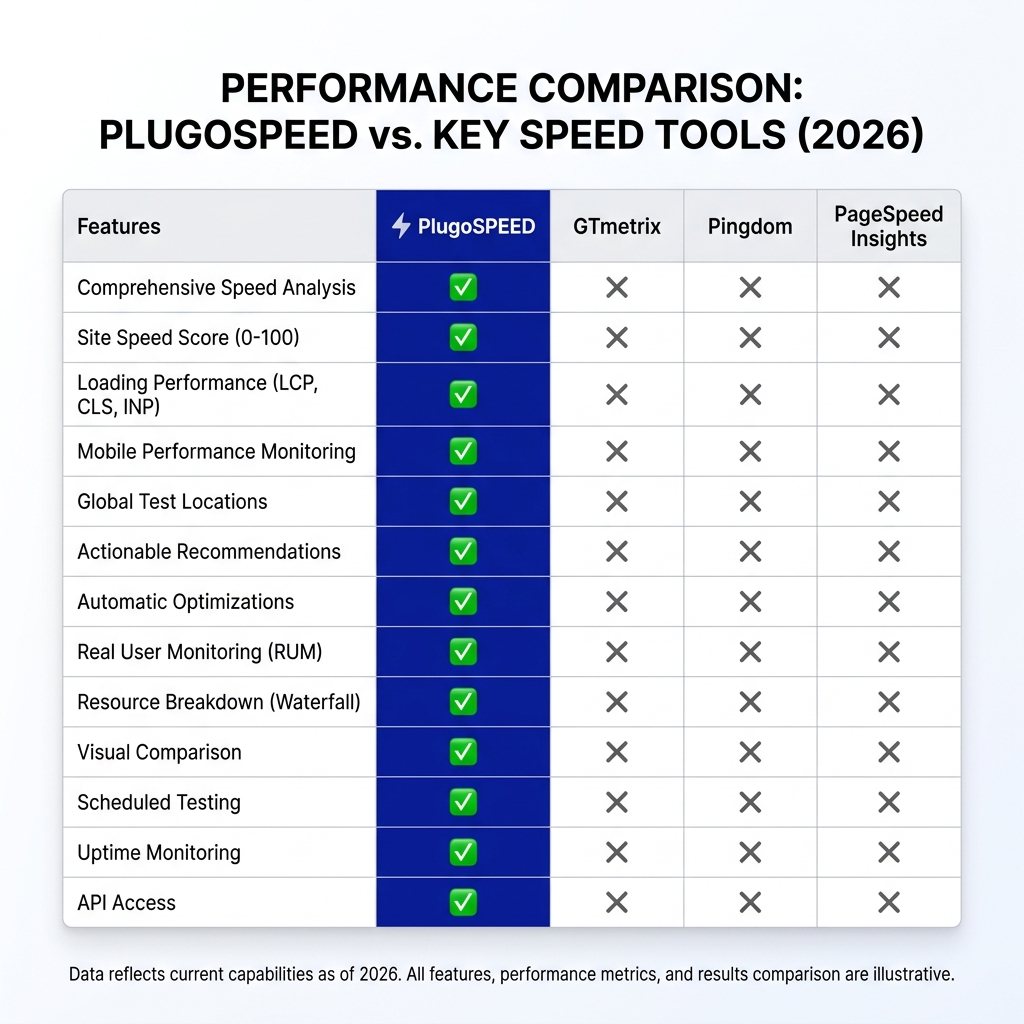
Choosing the right website speed testing tool matters more than most people realize. Different tools use fundamentally different measurement methodologies, which means the scores they produce can vary significantly — and some scores are far more actionable for SEO and real-world performance improvement than others. Here's a comprehensive, honest comparison of the four most widely used tools in 2026.
| Feature | PlugoSPEED Best | GTmetrix | Pingdom | PageSpeed Insights |
|---|---|---|---|---|
| Real Lighthouse Engine | ✓ | ✓ | ✗ | ✓ |
| WordPress Optimized | ✓ | ✗ | ✗ | ✗ |
| One-Click Auto Fix | ✓ | ✗ | ✗ | ✗ |
| Core Web Vitals | ✓ | ✓ | ✗ | ✓ |
| Mobile + Desktop | ✓ | ✓ | ✗ | ✓ |
| No Signup Required | ✓ | ✓ | ✓ | ✓ |
| 100% Free | ✓ | Limited | Limited | ✓ |
| Historical Tracking | ✓ Pro | Paid | Paid | ✗ |
| Speed Recommendations | ✓ Auto-fix | ✓ Manual | Basic | ✓ Manual |
| Critical CSS | ✓ Auto | ✗ | ✗ | ✗ |
PlugoSPEED Speed Test vs GTmetrix
GTmetrix has been one of the most popular speed testing tools since 2011, and for good reason — it provides detailed waterfall charts and has evolved to incorporate Lighthouse-based analysis. However, there are several meaningful differences between GTmetrix and our tool. GTmetrix's free plan significantly limits how often you can test and from how many server locations, requires account registration for full feature access, and presents its scores as a confusing blend of the legacy GTmetrix Grade system and Lighthouse-based performance scores. This dual-scoring system creates ambiguity: a site might receive a "B" GTmetrix grade with a 70% performance score, leaving users unsure which number matters for SEO.
More critically, GTmetrix has no integration with WordPress whatsoever. It will tell you that you should "eliminate render-blocking resources" or "defer offscreen images," but it can't tell you which WordPress plugin is causing the issue or automatically fix it. PlugoSPEED bridges this gap by connecting the test results directly to the PlugoSPEED plugin, which can implement the recommended optimizations with a single toggle. Unlike GTmetrix, we also focus exclusively on WordPress architecture, so our recommendations are immediately actionable within the WordPress ecosystem rather than being generic web development advice.
PlugoSPEED Speed Test vs Pingdom
Pingdom is primarily a website monitoring service that also offers a speed testing tool. However, Pingdom's speed test uses a proprietary measurement system based on HTTP waterfall analysis — not Google's Lighthouse engine. This is a fundamental limitation. Pingdom scores don't measure Core Web Vitals, don't assess mobile performance separately, and don't correlate with your Google PageSpeed Insights score in any meaningful way. A site can score 90/100 on Pingdom while scoring 45/100 on Google Lighthouse — and it's Google's score that affects your search rankings, not Pingdom's.
Pingdom is excellent for what it's actually designed for: uptime monitoring, tracking page load time trends over months, and receiving alerts when your site goes down. For the purpose of understanding and improving your Google search performance through speed optimization, however, Pingdom provides misleading data. Unlike Pingdom which uses its own measurement system, our tool uses the same Lighthouse engine that powers Google PageSpeed Insights, ensuring that every metric you see directly correlates to how Google evaluates your site.
PlugoSPEED Speed Test vs Google PageSpeed Insights
Google PageSpeed Insights (PSI) is the gold standard for performance measurement because it uses real Lighthouse data and, for sites with sufficient traffic, incorporates actual Chrome User Experience Report (CrUX) field data from real users. Our tool also uses the real Lighthouse engine, so the core scores will be identical or very close. The differences lie in usability and actionability. PageSpeed Insights provides generic recommendations written for web developers — "Eliminate render-blocking resources," "Reduce unused JavaScript" — without any context about what that means specifically for a WordPress site.
PlugoSPEED Speed Test translates these technical recommendations into WordPress-specific actions, identifies which plugins are likely causing the issues, and connects directly to automated fixes through the PlugoSPEED plugin. We also present the results in a more visual, user-friendly interface that makes it easier to understand your performance at a glance without needing to interpret raw JSON-formatted audit data. Think of us as PageSpeed Insights with a WordPress-fluent interpreter and an automated fix button built right in.
How to Improve Your WordPress Speed Score
Improving your WordPress PageSpeed score is not about finding one magic fix — it requires a systematic approach addressing both server-side performance and client-side rendering. The good news is that for most WordPress sites, the following ten optimizations will reliably move a score from the 40–60 range into the 85–95 range. We've ordered them by impact: the optimizations at the top of this list typically deliver the biggest score improvements.
1. Enable WordPress Page Caching
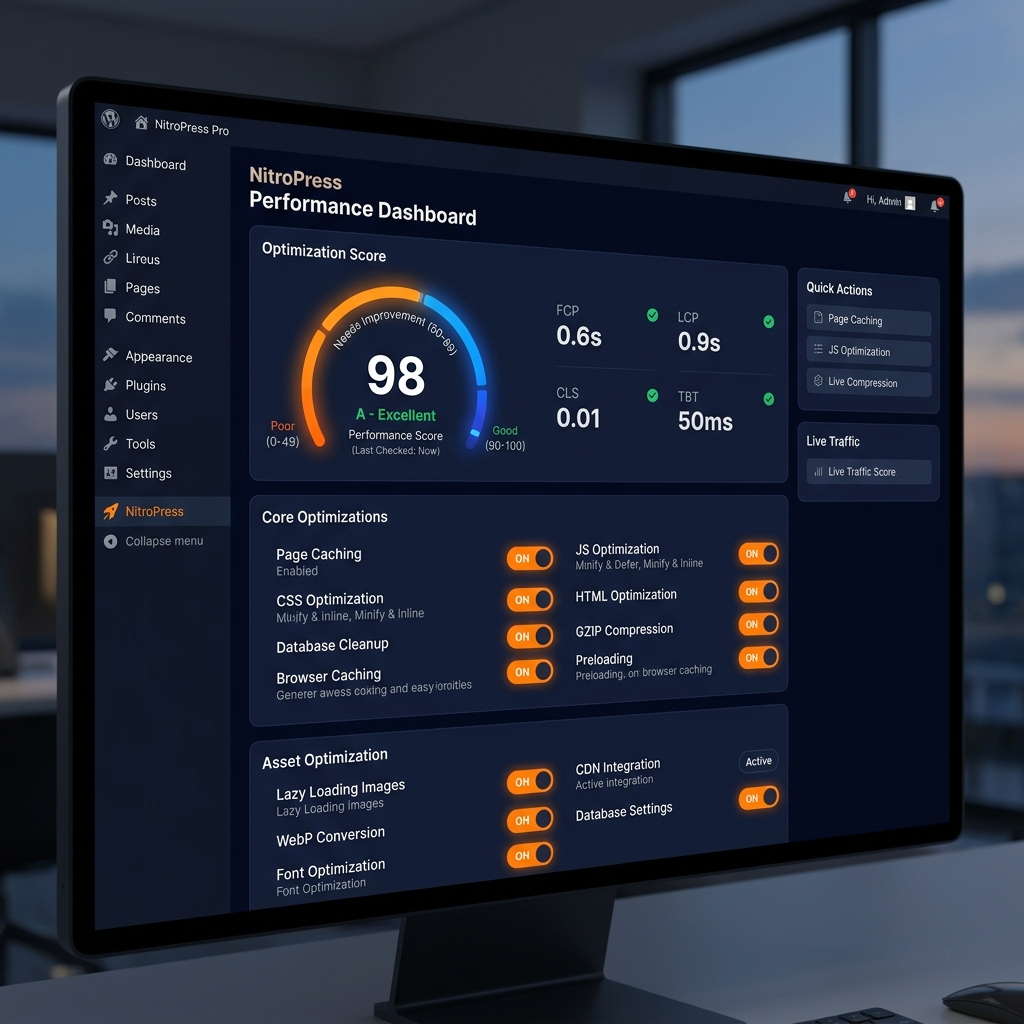
Page caching is the single highest-impact optimization available to WordPress sites. Without caching, WordPress executes PHP and queries MySQL for every page request — a process that can take 500ms–2000ms depending on your hosting. With caching enabled, a pre-built HTML file is served directly, reducing TTFB to under 100ms. This improvement cascades through every other performance metric. PlugoSPEED Pro includes a built-in smart caching system that automatically manages cache invalidation when content is updated, posts are published, or comments are added — no manual configuration required.
2. Minify CSS, JavaScript, and HTML
Minification removes all whitespace, comments, and unnecessary characters from your CSS, JavaScript, and HTML files without changing their functionality. A typical WordPress stylesheet can be reduced by 20–40% through minification, and JavaScript files often shrink by 30–50%. Smaller files transfer faster and parse faster, reducing the time the browser spends processing resources before rendering. PlugoSPEED Pro automatically minifies all assets from your theme and plugins, combining them intelligently to reduce the number of HTTP requests alongside the file sizes.
3. Implement Critical CSS (Above-the-Fold Optimization)
Critical CSS is one of the most impactful — and technically complex — optimizations for improving First Contentful Paint and Largest Contentful Paint. By default, WordPress loads all CSS in the <head>, blocking the browser from rendering any content until every stylesheet has been downloaded and parsed. Critical CSS extracts only the styles needed to render what's visible above the fold, inlines those styles directly in the HTML, and defers the remaining CSS to load asynchronously. This can reduce FCP by 1–2 seconds. PlugoSPEED Pro automates Critical CSS generation using a cloud-based service, making what was previously a manual, complex process completely hands-off.
4. Remove Unused CSS (RUCSS)
Most WordPress themes and plugins load CSS files containing thousands of rules, the vast majority of which are never used on any given page. WooCommerce, for example, loads its full CSS bundle even on pages with no shop functionality. This unused CSS adds unnecessary weight to every page — commonly 300–600KB of CSS that slows parsing and increases file sizes. Remove Unused CSS (RUCSS) analyzes each page and strips away only the CSS rules that are actually used, creating lean, page-specific stylesheets. PlugoSPEED Pro includes cloud-based RUCSS generation that processes pages automatically and serves optimized stylesheets without any server-side performance penalty.
5. Lazy Load Images and Iframes
Lazy loading defers the loading of images and embedded content (YouTube videos, maps, iframes) that are below the fold until the user scrolls near them. This dramatically reduces the initial page weight and number of network requests, improving load time and reducing bandwidth consumption. Modern browsers support native lazy loading via the loading="lazy" attribute, but WordPress needs to apply this consistently across all content — including images in post content, theme templates, and plugin output. PlugoSPEED Pro automatically adds the loading="lazy" attribute and implements lazy loading for iframes and YouTube embeds, complete with facade placeholders that display a thumbnail before the full embed loads.
6. Convert Images to WebP Format
WebP is a modern image format developed by Google that provides 25–35% smaller file sizes compared to JPEG and 26% smaller than PNG, with equivalent or better visual quality. Since images typically account for 50–70% of a typical web page's total byte weight, format optimization has an outsized impact on page load speed. WordPress 5.8+ supports WebP natively, but converting your existing library and ensuring all new uploads are automatically converted requires plugin support. PlugoSPEED Pro converts images to WebP on upload, serves WebP to supported browsers (with automatic JPEG/PNG fallback for older browsers like Safari on iOS 13), and can batch-convert your existing media library in the background.
7. Defer Non-Critical JavaScript
JavaScript is the number one cause of Total Blocking Time and high Interaction to Next Paint scores. Most WordPress plugins load their JavaScript files synchronously in the <head> or footer without deferral, meaning the browser must download, parse, and execute these scripts before it can respond to user input. Deferring non-critical JavaScript — slider libraries, social sharing buttons, chat widgets, analytics, marketing pixels — until after the page has rendered and the user begins interacting can dramatically reduce TBT and improve the perceived responsiveness of your site. PlugoSPEED Pro's JavaScript delay feature intelligently identifies which scripts can be safely deferred and delays their execution until the first user interaction (click, scroll, or keypress), yielding significant improvements with no impact on functionality.
8. Reduce Time to First Byte (TTFB)
TTFB reduction is primarily about server-side improvements. Upgrade from shared hosting to a VPS, managed WordPress hosting, or cloud provider with solid-state drives and adequate memory allocation for your site's traffic level. Enable PHP object caching (Redis or Memcached) to cache database query results in memory, eliminating repeated identical queries on every page load. Optimize your WordPress database by removing post revisions, spam comments, expired transients, and orphaned metadata using a database optimization tool. If your visitors are geographically distributed, deploy a CDN that caches entire pages at edge locations, effectively reducing TTFB to near zero for repeat visitors regardless of their location. PlugoSPEED Pro integrates with major CDN providers and includes database optimization utilities to address all of these TTFB factors.
9. Use a Content Delivery Network (CDN)
A Content Delivery Network distributes your static assets — images, CSS, JavaScript, fonts — across dozens or hundreds of server locations worldwide. When a user in Tokyo visits your New York–hosted WordPress site, without a CDN every resource must travel across the Pacific Ocean, adding 150–300ms of latency to each request. With a CDN, those same resources are served from a Tokyo edge node, reducing latency to under 10ms. Modern full-page CDNs can also cache your entire WordPress pages at the edge, completely bypassing your origin server for repeat visitors. PlugoSPEED Pro includes CDN integration and intelligent cache purging to ensure your visitors always receive fresh content without sacrificing the performance benefits of full-page caching.
10. Optimize Your WordPress Database
Over time, WordPress databases accumulate significant bloat: hundreds of post revisions for each article, thousands of spam comments, expired transient options, orphaned postmeta rows from deleted plugins, and unused taxonomy term relationships. A bloated database increases query execution time, which directly increases TTFB. WordPress by default stores unlimited post revisions — a blog with 500 posts and an average of 20 revisions per post has 10,000 revision rows slowing down every query that touches the wp_posts table. Regular database optimization using tools like PlugoSPEED Pro's database cleaner — combined with setting a sensible revision limit of 3–5 revisions per post — can reduce database query times by 20–50% on content-heavy sites.
🚀 Let PlugoSPEED Handle Everything Automatically
Instead of manually implementing each optimization above — which can take days of developer time and requires ongoing maintenance — PlugoSPEED Pro handles all of it with one click. Critical CSS generation, RUCSS, WebP conversion, JavaScript delay, smart caching, CDN integration, and database optimization are all automated and continually maintained as your content evolves.
Download PlugoSPEED Free →What Is a Good PageSpeed Score?
Google's Lighthouse performance score runs from 0 to 100, and understanding what different ranges actually mean for your site — and what's realistic to achieve for your specific type of website — is essential for setting meaningful performance goals. A common misconception is that anything less than 100 is a failure. In reality, there are practical upper limits for certain types of dynamic content, and improving from 45 to 85 delivers far greater real-world benefits than going from 95 to 100.

Understanding the Score Ranges
Google Lighthouse classifies performance scores into three ranges based on the distribution of real-world data from Chrome users. A score of 90–100 is classified as "Good" — these sites load quickly enough that users have a positive experience, and Google considers Core Web Vitals as passing for ranking purposes. A score of 50–89 is classified as "Needs Improvement" — these sites have room for optimization and may be underperforming in search rankings compared to faster competitors. A score of 0–49 is classified as "Poor" — these sites have serious performance issues that are likely causing high bounce rates, poor user experience, and significant SEO disadvantages.
The score is a weighted composite of five Lighthouse metrics: LCP contributes 25% of the score; TBT contributes 30%; FCP contributes 10%; Speed Index contributes 10%; and Time to Interactive (TTI) contributes 10%. The remaining 15% is composed of other audits. Understanding this weighting reveals that TBT and LCP are the highest-leverage metrics — optimizing these two areas will have the greatest impact on your overall score.
Industry Benchmarks by Site Type
Different types of websites have different performance baselines due to their content requirements. A simple blog or portfolio site with minimal dynamic content can realistically achieve 90–98/100 on mobile with proper optimization. E-commerce sites are inherently more challenging because product pages contain complex dynamic content, real-time inventory data, and often third-party payment and review scripts — well-optimized WooCommerce stores typically score 70–85 on mobile. Sites built with heavy page builders like Elementor or Divi face additional challenges from those frameworks' JavaScript and CSS overhead, with well-optimized examples typically achieving 65–80 on mobile.
Membership sites and course platforms (LearnDash, MemberPress) often include complex authentication flows and dynamic content that reduce scores to 60–75 on mobile. News and media sites with advertising — which adds significant third-party JavaScript — typically score 45–65. Understanding your site category's realistic ceiling helps you set appropriate goals and avoid chasing diminishing returns. A WooCommerce store scoring 78 on mobile may already be in the top 10% of e-commerce performers in its category.
Mobile vs Desktop: Why Mobile Score Matters More
You will almost always see a significant gap between your mobile and desktop scores — commonly 20–35 points. This is because Lighthouse's mobile simulation uses a slower CPU throttling factor and a slower network (simulating a mid-range device on a 4G connection), while desktop testing simulates a fast broadband connection with no CPU throttling. A site scoring 90 on desktop might score 62 on mobile — both tests are run against identical server infrastructure, but the simulated device conditions reveal how your site performs for the majority of users.
Google uses mobile-first indexing, meaning it crawls and indexes the mobile version of your site first and uses the mobile page's performance data for ranking purposes. This makes your mobile score the more SEO-critical of the two. If you have to choose where to focus your optimization efforts, prioritize mobile performance. The techniques that improve mobile scores — Critical CSS, image optimization, JavaScript deferral — also improve desktop scores, so mobile optimization efforts deliver double the benefit.
The Common Misconception: 100/100 Is Not Always the Goal
Chasing a perfect 100/100 Lighthouse score is a common trap that leads to over-optimization at the cost of functionality. Removing a necessary analytics script to save 5 points, disabling a critical UX feature to eliminate a small CLS issue, or serving oversimplified pages that don't convert — these tradeoffs are counterproductive. Google itself has stated that performance is one of many ranking signals and that a site with a 75 score and outstanding content, excellent backlinks, and strong user engagement signals will outrank a sterile 100/100 site with thin content.
The realistic goal for most WordPress site owners should be: 90+ on desktop and 75+ on mobile for informational sites; 85+ on desktop and 65+ on mobile for e-commerce; and ensuring all Core Web Vitals (LCP, CLS, INP) are in the "Good" range as measured by real Chrome user data in Google Search Console's Core Web Vitals report. Achieving these targets will put your site in the top quartile of performers globally and eliminate performance as a competitive disadvantage in organic search.
How to Test Website Speed Step by Step
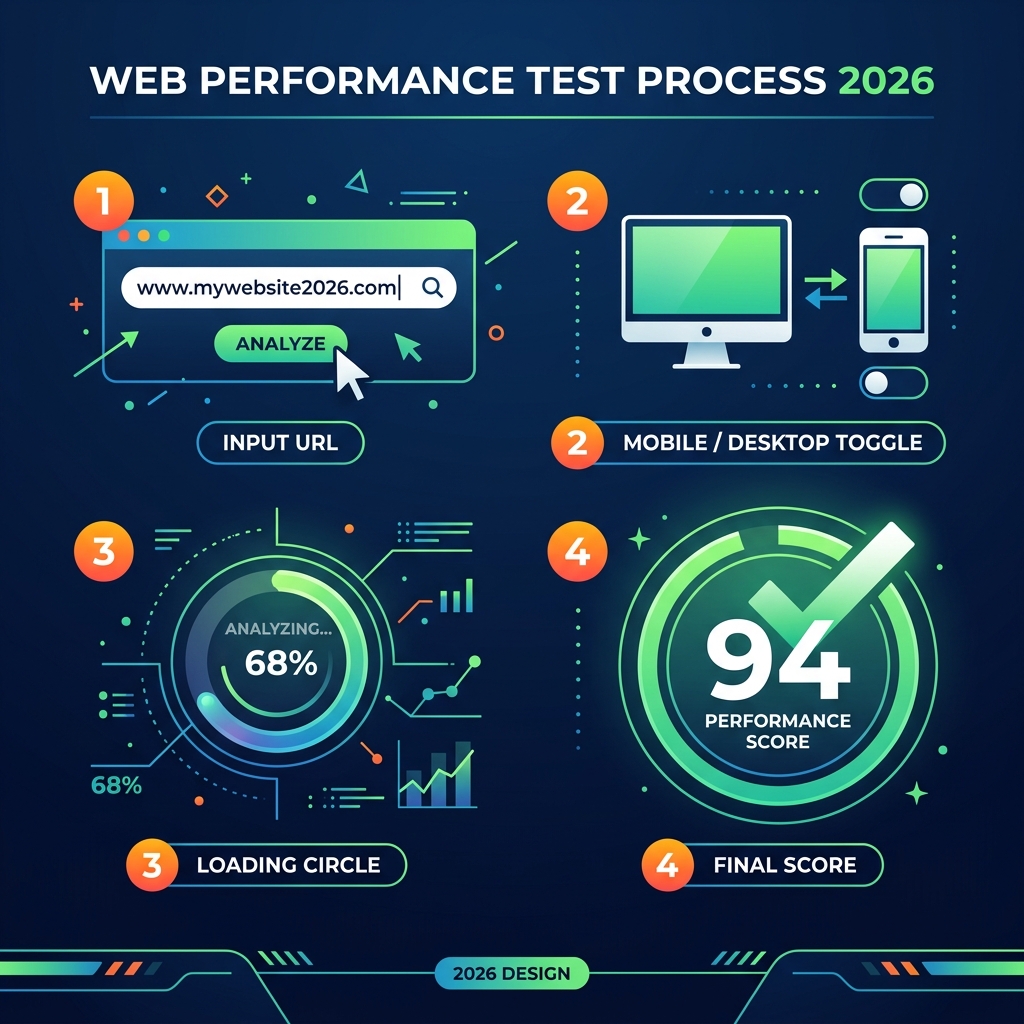
Running a website speed test with our tool takes less than 60 seconds from start to results. Here's exactly what to do and what to look for at each step to get the most out of your analysis.
-
Enter Your Complete Website URL
Type or paste your full website URL into the input field at the top of this page, including the
https://prefix. For most accurate results, test your homepage first — it's typically the highest-traffic page and the one most likely to be crawled by Google. If you want to test a specific landing page, product page, or article, enter that URL directly. Our tool accepts any publicly accessible URL. If your site is on localhost or behind a password, you'll need to test a live, publicly accessible version.Pro tip: If you're running optimization experiments, test the same URL multiple times in different sessions and average the results. Lighthouse scores can vary by ±5 points between runs due to network variability — this is normal and expected.
-
Select Your Device Type
Choose between Mobile and Desktop testing using the toggle buttons next to the URL input. We strongly recommend starting with Mobile. Google uses mobile-first indexing for all websites, meaning the mobile version of your site is what Google crawls and evaluates for ranking purposes. Mobile Lighthouse testing simulates a mid-range Android device (approximately a Moto G4) on a 4G connection with CPU throttling — conditions that affect the majority of real-world mobile users.
Desktop testing uses a fast broadband connection with no CPU throttling, which is why desktop scores are typically 20–30 points higher. Run both tests to understand the full picture, but treat your mobile score as the primary SEO-relevant metric.
-
Click "Analyze Now"
Click the blue "Analyze Now →" button to submit your URL for analysis. Our system will queue your request and dispatch it to our Lighthouse analysis infrastructure on DigitalOcean. The analysis runs with a real Chromium browser instance controlled by the Lighthouse CLI — the identical setup used by Google's own PageSpeed Insights API. This means you get laboratory-condition results that accurately reflect Google's own assessment of your page.
The URL will be saved as a query parameter (e.g.,
?url=https://example.com) so you can bookmark or share your test results page. You can share this URL with developers or colleagues so they can see exactly what was tested. -
Wait for the Lighthouse Analysis
Real Lighthouse analysis takes 15–30 seconds. During this time, you'll see an animated progress indicator showing which stage of the analysis is running: connecting to your website, running the Lighthouse engine, calculating Core Web Vitals, and generating recommendations. This is not a simulated wait — the analysis is genuinely running a full Chromium browser session against your live website. The progress indicator will cycle through all four stages as the analysis completes.
If your site is particularly slow or has server-side issues, the analysis may take up to 60 seconds. If the analysis exceeds 2 minutes, it will time out — this typically indicates a server-side problem with your hosting that is preventing the page from loading at all. Make sure your website is online and accessible before running the test.
-
Review Your Overall Performance Score
Your overall Performance Score is displayed in the large circular gauge at the top of the results. The score ranges from 0 to 100: 90–100 (green) is excellent, 50–89 (orange) needs improvement, and 0–49 (red) is poor. The score is color-coded to make immediate assessment easy. If your score is below 70, there are likely significant, high-impact optimizations available. If it's between 70–89, focused improvements to your top 2–3 metrics will likely push you into the excellent range.
-
Check Each Core Web Vital Metric
Below the overall score, you'll see individual metric cards for LCP, FCP, TBT, CLS, TTFB, and INP. Each card is color-coded — green for good, orange for needs improvement, red for poor — and shows the threshold for a good value. Identify which metrics are failing first: TBT and LCP failures are the most common and have the highest score impact. CLS failures are also important as they directly affect user experience and the Core Web Vitals "Passed" assessment in Google Search Console.
-
Read the Opportunities Section
Scroll down to the Opportunities section, which lists the specific issues found during the analysis ranked by their potential score impact, expressed as milliseconds of load time savings. Focus on the top 3–5 opportunities first — these will deliver the biggest return on your optimization effort. Each opportunity includes the specific finding and the estimated time savings if it were resolved. Common opportunities include "Eliminate render-blocking resources," "Reduce unused JavaScript," "Properly size images," and "Serve images in next-gen formats."
-
Apply the Recommended Fixes
After reviewing your results, implement the recommended optimizations. For WordPress sites, the fastest path to improvement is installing PlugoSPEED Pro, which automatically addresses the most common opportunities: Critical CSS, RUCSS, JavaScript delay, WebP conversion, lazy loading, and page caching. After applying fixes, run the test again using the "Test Again" button to measure your improvement. Most well-optimized WordPress sites see their scores improve by 20–40 points after enabling PlugoSPEED Pro's full optimization suite.
Why WordPress Sites Are Often Slow
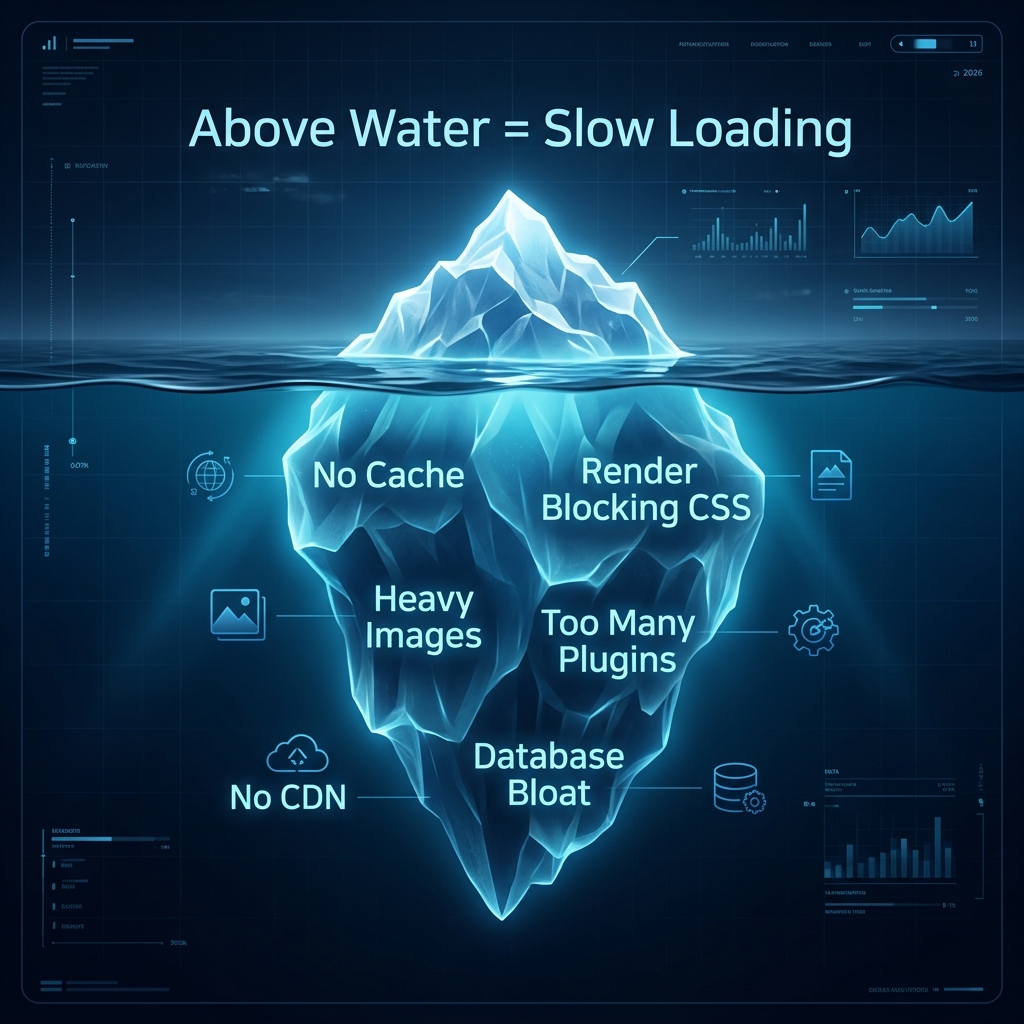
WordPress is extraordinarily flexible and powers nearly half the internet — but that flexibility comes with performance tradeoffs that are unique to the platform. Understanding the specific architectural and ecosystem reasons why WordPress sites tend to underperform helps you target your optimization efforts precisely and avoid common mistakes. The issues below are the ones our speed test most frequently identifies in the thousands of WordPress sites tested through our platform.
Render-Blocking CSS and JavaScript
By default, WordPress loads CSS stylesheets in the <head> and JavaScript files throughout the page without any optimization for rendering priority. When a browser encounters a stylesheet in the <head>, it must fully download and parse that file before it can render a single pixel of content. A typical WordPress installation with 10–20 plugins can have 15–30 stylesheets and 20–40 JavaScript files, each loaded without consideration for whether they're needed for above-the-fold rendering. This creates a render-blocking cascade that delays FCP and LCP by 1–3 seconds on mobile. The fix — Critical CSS and JavaScript deferral — is exactly what PlugoSPEED Pro automates.
Unoptimized Images Without WebP or Lazy Loading
Images are the largest contributor to page weight on most WordPress sites. A poorly optimized WordPress site typically serves images in legacy JPEG or PNG formats at oversized dimensions, without compression, without WebP conversion, and without lazy loading — loading all images on the page simultaneously regardless of whether they're visible. A single hero image might be 3MB instead of 150KB after proper WebP conversion and compression. Multiply this across all images on a page and you can easily have 10–20MB of total image weight when 1–2MB would be adequate. WordPress's default media handling does minimal optimization, making image optimization plugins or PlugoSPEED Pro's built-in image pipeline essential.
No Page Caching Enabled
WordPress generates pages dynamically using PHP and MySQL — without caching, every visitor's browser request triggers the complete page generation process from scratch. On a shared hosting server handling multiple sites simultaneously, this dynamic generation can take 500ms to 2000ms for the server to produce the initial HTML, before a single byte reaches the browser. This is the most common reason for high TTFB scores. Yet despite its importance, WordPress ships with no caching mechanism whatsoever. New WordPress installations — and many sites maintained by non-technical owners — often run completely uncached for years, accepting this massive performance penalty unknowingly.
Too Many Plugins Loading Unnecessary Scripts
The WordPress plugin ecosystem's greatest strength is also its biggest performance liability. Each plugin is independently developed and typically loads its CSS and JavaScript on every page regardless of whether that page actually uses the plugin's functionality. A contact form plugin loads its JavaScript on product pages where no form exists. A WooCommerce plugin loads its full CSS on blog posts with no shop functionality. A social sharing plugin loads its API scripts even on pages with sharing disabled. The cumulative effect of 20–40 plugins each adding 1–3 HTTP requests is 40–120 unnecessary network requests on every page load. Plugin script management — deciding which scripts should load on which pages — is one of the most impactful but technically demanding WordPress optimizations.
Shared Hosting with Limited Resources
Shared hosting environments — where dozens or hundreds of WordPress sites share the same physical server — impose strict resource limits that fundamentally constrain performance. Limited CPU time means complex PHP execution takes longer. Limited memory means caching solutions can't store as much data. High server load from neighboring sites on the same server causes unpredictable TTFB spikes. Disk I/O limitations slow database queries and file operations. A WordPress site on quality managed WordPress hosting (Kinsta, WP Engine, Cloudways) can have TTFB 5–10x lower than the same site on budget shared hosting. Hosting quality is often the bottleneck that limits the effectiveness of other optimizations.
No Content Delivery Network (CDN)
Without a CDN, every visitor fetches your site's resources from a single origin server location. If your server is in New York and your visitor is in Singapore, every resource request must travel halfway around the world and back — adding 200–400ms of latency to every asset. Multiply this by 40–100 assets on a typical WordPress page and you have 8–40 additional seconds of total network latency that users in distant geographies experience. A CDN with edge nodes worldwide serves resources from the closest available location, reducing asset delivery latency to under 10ms globally. For global audiences, a CDN is not optional — it's mandatory for competitive performance.
WordPress Database Bloat
WordPress stores an enormous amount of data in its database tables, much of which accumulates as waste over time. Post revisions — WordPress saves every version of every post by default, with no limit — can number in the tens of thousands for active blogs. Expired transient options (temporary data cached by plugins) remain in the wp_options table long after their expiration. Orphaned postmeta rows from deleted plugins. Spam comments in the moderation queue. Trash items never permanently deleted. All of this data means larger database tables, longer query scan times, and slower PHP execution. Regular database maintenance using WP-CLI or a tool like PlugoSPEED Pro's database optimizer can recover significant performance, particularly for older WordPress sites that haven't been regularly maintained.
Heavy Page Builder Dependencies (Elementor, Divi)
Page builders like Elementor and Divi are enormously popular — and enormously heavy. Elementor's frontend assets include 400–600KB of JavaScript and multiple large CSS files loaded on every page built with Elementor, regardless of which widgets or features that specific page uses. Divi has similar overhead. These page builders prioritize design flexibility over performance, and while they've improved over time, they remain among the most significant contributors to poor Lighthouse scores on WordPress sites. Sites built with Elementor or Divi need especially aggressive optimization — Critical CSS, RUCSS, and JavaScript delay are practically mandatory to achieve acceptable scores.
External Fonts Loading Synchronously
Google Fonts and other web font services are extremely popular in WordPress themes, but loading them the default way — via a <link> tag in the <head> that fetches fonts from an external server — creates multiple performance problems. The external DNS lookup and connection add latency. The fonts block rendering until they're downloaded, contributing to FCP delay. When fonts finally load and replace the fallback font, text may shift position if the metrics don't match precisely, contributing to CLS. The fix involves self-hosting fonts (downloading them to your server), using font-display: swap, and preloading the most critical fonts — all of which PlugoSPEED Pro handles automatically.
Missing Critical CSS Causing Render Blocking
The absence of Critical CSS is simultaneously one of the most impactful and most overlooked performance problems in WordPress. Without Critical CSS, the browser must download and parse your complete CSS bundle — which can be 500KB–1MB or more on Elementor-built sites — before it renders a single visible element. Users see a blank white screen for 1–4 seconds while this processing happens. With Critical CSS, only the 10–20KB of styles needed to render the above-the-fold content is delivered immediately, and the rest is deferred. The perceptual improvement is dramatic — users see content almost instantly while the remaining styles load in the background. PlugoSPEED Pro's cloud-based Critical CSS generation engine analyzes each page type and produces optimized, page-specific Critical CSS automatically.
Frequently Asked Questions About Website Speed Testing
Is this WordPress speed test completely free?
Yes, the PlugoSPEED Website Speed Test is 100% free with absolutely no restrictions: no signup required, no credit card, no usage limits, and no premium tier needed to see your full results. You can test unlimited URLs across both mobile and desktop as frequently as you like. Our free speed test uses the same real Lighthouse engine as Google PageSpeed Insights, ensuring the results you see are identical to what Google sees when evaluating your site. We believe that every WordPress site owner — from independent bloggers to enterprise businesses — deserves access to professional-grade performance analysis without barriers or paywalls. The test will always be free because we believe in growing our user base through value, not through limiting free tiers.
How is PlugoSPEED Speed Test different from GTmetrix?
While both tools use the Lighthouse engine for performance analysis, the differences in focus and usability are significant. GTmetrix blends its legacy proprietary scoring with Lighthouse scores, creating a confusing dual-grade system that many users find difficult to interpret in relation to actual Google rankings. GTmetrix's free plan also limits test frequency, requires account registration for deeper analysis, and has no WordPress-specific intelligence — it will tell you to "eliminate render-blocking resources" without helping you understand which WordPress plugin is responsible or how to fix it in a WordPress context.
PlugoSPEED Speed Test is built exclusively for WordPress, with recommendations that map directly to WordPress-specific causes and solutions. More importantly, our tool connects directly to the PlugoSPEED plugin, which can implement the recommended optimizations automatically — Critical CSS, RUCSS, JavaScript delay, image optimization, and caching — without requiring any developer involvement. GTmetrix is an excellent diagnostic tool for web developers; PlugoSPEED is designed to be actionable for every WordPress user, technical or not.
How is this different from Google PageSpeed Insights?
Our tool uses the identical real Lighthouse engine as Google PageSpeed Insights (PSI), so the Core Web Vitals scores you receive will be essentially the same as what PSI reports. The primary differences are in interpretation, usability, and actionability. PageSpeed Insights was designed by and for web developers — it presents raw Lighthouse audit data in a dense, technical format that requires significant expertise to interpret and act upon. The recommendations are accurate but generic, with no WordPress context or automated fixes.
PlugoSPEED Speed Test presents the same data in a visually clear format designed for non-developers, translates technical findings into WordPress-specific explanations ("Your render-blocking resources include wp-content/plugins/contact-form-7/includes/css/styles.css"), and provides a direct path to automated resolution through the PlugoSPEED plugin. Additionally, PSI incorporates real-world Chrome User Experience Report (CrUX) data for high-traffic sites alongside Lighthouse data, which can create confusing discrepancies — our tool focuses purely on Lighthouse lab data for consistent, reproducible results.
How is this different from Pingdom?
Pingdom uses a proprietary HTTP waterfall-based measurement system that is fundamentally different from Google's Lighthouse engine. Pingdom's scores measure how quickly HTTP resources load in sequence — a useful metric for identifying large files and slow servers, but completely disconnected from the Core Web Vitals that Google uses as ranking signals. A site can score 90/100 on Pingdom while scoring 35/100 on Google Lighthouse and performing poorly in search rankings — this disconnect confuses many site owners who rely on Pingdom scores as a proxy for SEO performance.
Pingdom also cannot measure mobile performance separately (it only tests from a desktop perspective), doesn't measure First Contentful Paint, Largest Contentful Paint, Total Blocking Time, Cumulative Layout Shift, or Interaction to Next Paint — the six metrics that actually matter for Google's evaluation. Pingdom's primary strength is uptime monitoring and long-term load time trend tracking, which is a genuinely useful purpose. For understanding and improving your search engine performance through speed optimization, however, Lighthouse-based tools like PlugoSPEED Speed Test provide far more relevant and actionable data.
What is a good website speed score?
Google Lighthouse classifies performance scores as follows: 90–100 is "Good" (green), 50–89 is "Needs Improvement" (orange), and 0–49 is "Poor" (red). For SEO purposes, the "Good" range on mobile is the target most site owners should prioritize, as Google uses mobile-first indexing. However, what constitutes a "good" score in practice depends significantly on your site type. A simple blog can realistically achieve 90–98 on mobile with proper optimization, while a complex WooCommerce store with multiple payment gateways and review systems might peak at 70–80 on mobile due to necessary third-party script requirements.
Rather than focusing solely on the overall score number, pay close attention to whether each individual Core Web Vital (LCP, CLS, INP) is in the "Good" range. These three metrics are what Google evaluates for its Core Web Vitals assessment in Search Console, and passing all three has been shown to correlate with search ranking improvements independently of the overall Lighthouse score. A site with a 78/100 overall score but all three Core Web Vitals in the "Good" range may outrank a competitor with an 85/100 overall score that has one failing Core Web Vital.
How often should I test my website speed?
The frequency of speed testing should be tied to the pace of change on your website. As a minimum baseline, running a monthly speed test is a good practice for any website — this catches gradual performance degradation from plugin updates, new content, or hosting changes before it becomes a significant problem. More specifically, you should always test after the following events: installing or updating any plugin or theme; adding new types of content (videos, galleries, new page templates); migrating to a new host or server; updating to a new version of WordPress; adding any new third-party script (analytics, chat widget, marketing pixel); or after implementing optimizations to verify their impact.
For e-commerce sites and high-traffic content sites where performance has direct revenue impact, weekly testing with automated alerts for score drops is worth the investment. PlugoSPEED Pro's historical tracking feature (coming soon) will automate this monitoring, sending notifications if your performance score drops significantly after any event — allowing you to catch and fix regressions before they affect your search rankings or conversion rates.
What is LCP and why does it matter for SEO?
Largest Contentful Paint (LCP) measures the time from when a page starts loading until the largest content element visible in the viewport — typically a hero image, video thumbnail, or large heading — is fully rendered. Google's threshold for a "Good" LCP is under 2.5 seconds. LCP is a direct Google ranking signal as one of the three official Core Web Vitals, making it one of the most SEO-critical performance metrics available. In Google Search Console's Core Web Vitals report, pages with "Good" LCP are explicitly identified as passing the assessment, while pages with "Poor" LCP are flagged as URLs needing improvement.
Beyond rankings, LCP has a strong correlation with user experience and conversion rates. When the largest, most meaningful visual element on your page takes more than 2.5 seconds to appear, users perceive the site as slow and unresponsive — increasing bounce rates regardless of how fast subsequent interactions feel. Common fixes for slow LCP include: converting your hero image to WebP and preloading it with <link rel="preload">; implementing Critical CSS to eliminate render-blocking stylesheets; upgrading hosting or adding a CDN to reduce TTFB; and ensuring the LCP element isn't loaded lazily (lazy loading should never be applied to the above-the-fold hero element).
Can I test both mobile and desktop speed?
Yes, our tool supports both Mobile and Desktop testing with a single click on the device toggle buttons in the test form. You can run both tests on the same URL to see the full performance picture. Mobile testing uses Lighthouse's standard mobile simulation: a Moto G4-equivalent device with Snapdragon 400-class CPU throttling and a simulated fast 4G network connection (10Mbps, 40ms RTT). Desktop testing uses a faster CPU and a simulated broadband connection with no throttling, which is why desktop scores are typically 20–35 points higher than mobile scores for the same site.
We strongly recommend testing mobile first and treating it as your primary metric for SEO purposes. Since 2019, Google has used mobile-first indexing for all websites, meaning the mobile version of your pages is what Google crawls, indexes, and evaluates for ranking. If your mobile score is significantly lower than your desktop score, prioritizing mobile optimizations — which typically focus on JavaScript execution time and image loading — will deliver the greatest SEO benefit. The good news is that most mobile-focused optimizations (Critical CSS, JS delay, WebP, lazy loading) also improve desktop scores simultaneously.
What is TTFB and how do I improve it?
Time to First Byte (TTFB) measures the duration from when the browser initiates an HTTP request for a page until the first byte of the response is received from the server. It encompasses DNS resolution time, TCP connection time, SSL/TLS handshake time, and most importantly, the server's processing time to generate the page HTML. Google's "Good" threshold for TTFB is under 800ms. High TTFB is often the root cause of multiple other performance problems — if your server takes 2 seconds to respond, every subsequent metric (FCP, LCP, everything) is delayed by at least 2 seconds.
The most impactful TTFB improvements for WordPress are: (1) Enable full-page caching so pre-built HTML files are served directly without PHP/MySQL execution, reducing TTFB from 1000–2000ms to under 100ms; (2) Upgrade to better hosting — managed WordPress hosts (Kinsta, WP Engine, Cloudways) with fast SSD storage, Redis object caching, and optimized PHP-FPM configurations deliver significantly lower TTFB than shared hosting; (3) Add a CDN with full-page caching so returning visitors receive pages from edge locations near them; (4) Optimize database queries by cleaning up transients, post revisions, and enabling Redis or Memcached for query result caching. PlugoSPEED Pro's built-in caching addresses the first point automatically, with CDN integration available for the third.
How do I fix a low PageSpeed score on WordPress?
Fixing a low WordPress PageSpeed score requires addressing both server-side and client-side performance. The most impactful improvements, in order of typical score impact, are: (1) Implement Critical CSS to eliminate render-blocking stylesheets — this alone can improve FCP and LCP by 1–2 seconds; (2) Enable page caching to reduce TTFB from seconds to milliseconds; (3) Defer non-critical JavaScript to reduce Total Blocking Time; (4) Remove Unused CSS to reduce CSS parsing overhead; (5) Convert images to WebP and add lazy loading; (6) Upgrade hosting if your TTFB exceeds 600ms even with caching enabled. Running our free speed test will identify which of these issues apply to your specific site and in what order they should be prioritized based on their impact.
For WordPress site owners who aren't web developers, manually implementing these optimizations requires significant technical knowledge — Critical CSS generation alone is a complex, per-page process that needs to be regenerated whenever your design changes. PlugoSPEED Pro automates the entire optimization stack: a single plugin installation handles Critical CSS generation, RUCSS, JavaScript delay, WebP conversion, lazy loading, smart caching, and more. Most WordPress sites running PlugoSPEED Pro see their Lighthouse scores improve by 20–40 points within minutes of activation, with Core Web Vitals moving from "Poor" or "Needs Improvement" to "Good" without any manual configuration required.